
England’s third round Six Nations contest with Ireland will feature a match day squad without Mike Brown for the first time since their 14-14 draw with South Africa back in June 2012.
The Harlequins full-back tops the Opta rugby statistics for metres made (2102m), clean breaks (24) and defenders beaten (98) in England games, since 2012. These quantity stats and those that relate to performances in an individual game tend to receive the most attention.
As an example, Chris Robshaw’s tally of 45 tackles in two games in this current Six Nations tournament has been widely shared.
The fact that Brown is responsible for 14.7% of England’s metres made in this period, 16.6% of defenders beaten and accounts for six of the 11 performances when a player has carried over 100m could be used to highlight what England will miss without him. 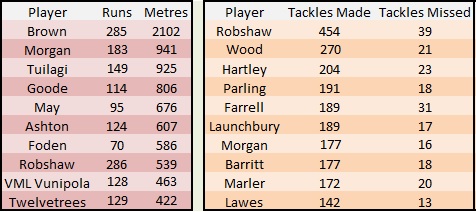
Context is required though.
The players that top the above tables for metres made and tackles are also the most picked, by coach Stuart Lancaster. Chris Robshaw and Mike Brown have played in 33 and 32 Tests respectively in three years and racked up 2640 and 2032 minutes of game time. Only nine of the 67 players to have taken the field in the 36 England Tests since 2012 have totalled more than 1440 minutes of game time.
It is possible to measure the contribution of England players in this period, without the results being weighted as heavily in favour of those who have played the most minutes.
Below is a look at average metres made per run and runs per game, along with how often a tackle has been made. The selection was limited to the 36 players who had played more than 400 minutes since 2012. 
While Brown ranks fourth for average metres made per run, he carries more often than the other players on that list and would rate top for average metres made per game, with 82.8m. The next highest is Alex Goode, with 74.5m a game.
Manu Tuilagi has carried for an average of 55.8m an appearance and while an exact replacement for the destructive centre is not possible, the current midfield combination of Jonathan Joseph (average of 45.4m per game) and Luther Burrell (41m) is proving effective.
The appearance of Mako Vunipola and Tom Youngs on the tackling chart might be surprising, but those numbers do fit their performances on the 2013 British and Irish Lions tour – when the former averaged a tackle every 6.5 minutes and the latter 6.8. It is also true that the tackle rate for substitutes is often superior to starters. As an example, Youngs averages a tackle every 3.97 minutes as a replacement and 7.84 minutes when starting. For Dave Attwood it is 4.6 minutes as a sub and 7.28 minutes as a starter.
It does put into context Robshaw’s rate of a tackle every 5.8 minutes, given he plays the full 80 minutes in each appearance. Along with a healthy tackle rate of one every 7.6 minutes for a regular starter, it should also be noted that Wasps lock Joe Launchbury has a very low error count. He has conceded just three penalties in 1427 Test minutes and concedes a penalty or turnover every 89 minutes.

Expanding the selection to minutes per run or tackle, it can be seen above that the Vunipola brothers have recorded very similar rates. Again, Mako Vunipola’s figure is line with his 2013 Lions tour level – when he averaged a run and tackle every 3.3 minutes and was second only after Seán O’Brien at 3.28 minutes.
The average appearance time does have to be factored in though and players on that list missing for the Ireland game such as Tom Wood, Launchbury and Brad Barritt are among those capable of maintaining a high level of workrate over a longer period.
Including Mike Brown, England will be without ten of their 15 most selected players since 2012, for their match in Dublin. While that does remove a chance to give established combinations more time, there is the opportunity for some of the less experienced players to prove their worth before the Rugby World Cup. As an example and allowing for a relatively small sample of 285 minutes, George Kruis currently averages a tackle every 6.6 minutes, a run or tackle every 4.67 minutes and has conceded just the one penalty or turnover.
There may be satisfaction with that current squad depth and the development of genuine competition for most positions. However one problem that Lancaster has managed to avoid is how he would replace his captain’s contribution. New Zealand have managed a similar situation by giving Sam Cane 11 starts in the No 7 shirt since 2012, compared to 31 for Richie McCaw. Chris Robshaw’s average performance of 6.9 passes, 8.6 runs, 13.7 tackles and playing the full 80 minutes wouldn’t be easily replicated, but perhaps the World Cup warm-up matches in August and September will be used to give a potential backup a chance.