
With the help of Opta by Stats Perform, we look at how teams used their lineouts throughout the Six Nations
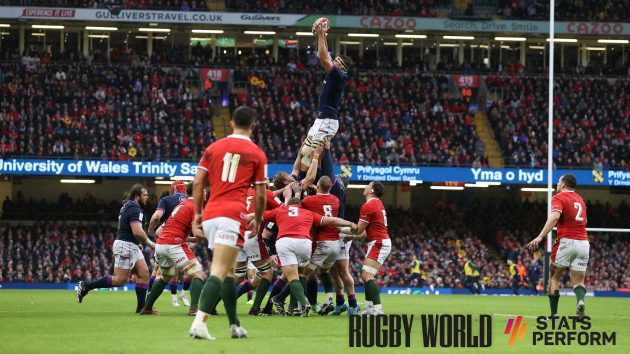
Six Nations analysis: Lineout trends
Perusing scoring trends throughout the top leagues, the importance of the set-piece platform is clear to see. Lineouts are big business, baby.
However, if we look at the data from the 2022 Six Nations, thanks to Opta by Stats Perform, you notice exactly who makes the most hay from the set-peice. And amongst it all there are some initial observations to make.
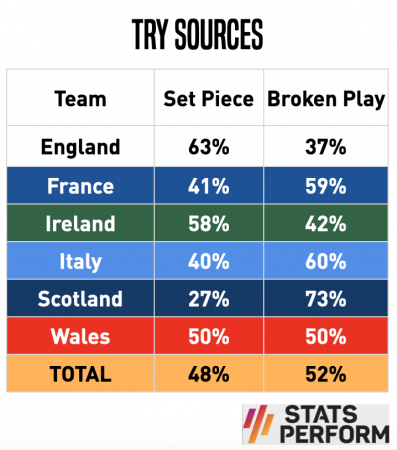
Obviously, this is ‘set-piece’, not just the lineout. But as you can see from the above, England created most of their tries from a set-piece. Scotland easily created the fewest scores from their set-piece, while Wales were bang on 50-50 for tries off set-piece versus broken play.
However, there’s not a huge amount to glean from just this, without context. Then we go a layer deeper, to look at tries created from your own lineouts specifically.

First, the elephant at the top of the graphic. The ‘Zero maul tries’. A quirk of the data collection means that if a player shears off to score from a maul – Tomas Francis against Scotland, or the Josh van der Flier score, for example – it’s counted as an individual’s score. So that number concerns a whole maul unit pushing over the try-line as one. And we didn’t see that once this Six Nations.
Crazy that, right?
Of course, we can point to dominant units and say, ‘Well, their lineout created a score anyway.’ And you would be right. It just adds an extra layer of context to discussing who had the most dominant drive or when someone is mouthing off about a kicker for not getting a few metres more from kicks to the corner (how much difference it makes is something you can debate ‘til the oxygen runs out).
Related: Six Nations analysis: A tale of two playing styles
But the numbers of scores generated is a start point. England and Wales created four scores from their lineouts. While Ireland – oh boy – got themselves 11 from the starting platform of a throw-in. That’s from their total of 24. Scotland, as you can see, are down there at two.
Now if we look at lineout targets, that brings in something new to discuss.

If we look primarily at the overall success of their lineout, Scotland are only behind the Irish on this, at 93.3%. But they scored just twice from their platform. As you’ll see further down, where they are at lineout time can contribute.
Wales had the lowest percentage, but scored half of all their tries this year from a starting point of the lineout.
Overwhelmingly Wales threw to the front or the middle. That’s 92% of what most would consider the most conservative of throws, for the lowest success rate. Of course, be mindful that only a few errors can shift these numbers, but this is the Test arena.
Italy also went largely front or back, France played it relatively ‘safe’ with Cameron Woki a chief target or – when he was covered, a Gregory Alldritt could take it at the front – and England are fairly even across their targets. Here’s something to note: Ireland were the most successful unit (no surprise there) but never threw it over the 15m line, while Scotland as the second-most successful unit were happy to fling it over the back 9% of the time.
Peel away another layer…

From this, there are a few clear takeaways, as analyst Ross Hamilton points out: “England rely on a five-man lineout the most, with very few seven-man ones.
“France had 10% of their lineouts as quick throws and had the lowest number of five-man lineouts. So they either went quick or made a point of putting full numbers in.
“Then with Wales, they had not a single quick throw-in nor did they ever go with fewer than five in. The six-man lineout was clearly their go-to.”
When England did use five players, the benefit of picking Courtney Lawes at six is worth having a look at too, with him and the locks being options within that shortened line.

Now to complete the picture of the lineouts, you can look at where on the field teams were throwing to themselves. And right away you see that Scotland have a load of throw-ins in their own 22, which is clearly not where you want to be. In the great territory battle, they begin on the back foot more than most.
It’s also noteworthy that while England are below the average for lineouts in the opposition half, Grand Slam winners France stick out a little more for how few throws they have in the opposition red zone – perhaps pointing to their other means of barrelling into the 22. Meanwhile, Ireland had the most lineouts as a percentage of their total, in the opposition half. Pressure is their game, after all.
If you look at Wales here, they are the only team not to have their most lineouts between the halfway and the opposition 22, but a huge amount inside the opposition 22.
Which if you whack all the pieces together suggests a real push to get a lineout in the opposition 22, have a six-player lineout with another forward as the plus-one in the nine position, try to drive it over and get the try. Four times they created tries from their lineout.
Scotland scored half as many as that again from that platform. That’s with the second-best success rate – though you caveat that with the fact they had the fewest lineouts in the opposition 22, and the most in their own. How will Scotland and Wales reflect on their tactics here?
Meanwhile, in a general sense Ireland come out of this breakdown very well.
Download the digital edition of Rugby World straight to your tablet or subscribe to the print edition to get the magazine delivered to your door.
Follow Rugby World on Facebook, Instagram and Twitter.